How to Structure a Chart of Accounts for Clear Reporting

A useful chart of accounts groups financial activity into five categories: assets, liabilities, equity, revenue, and expenses. A common numbering convention places assets in 1000-1999, liabilities in 2000-2999, equity in 3000-3999, revenue in 4000-4999, cost of goods sold in 5000-5999, and operating expenses in 6000-7999. Knowing how to structure my chart of accounts means choosing a clear, consistent system that fits the business, rather than treating one numbering pattern as a universal rule.
It’s easy to assume that more categories make reports more useful, but excessive detail can complicate bookkeeping and hide the patterns you need to see. A well-organized chart of accounts gives every transaction a clear home and makes financial reports easier to interpret. This guide explains how the five account types connect to the balance sheet and income statement, how to organize expenses for tax reporting, and how to leave room for future accounts. It also covers how to add accounts or reallocate balances while keeping reports consistent.
Table of Contents
The five main account types and numbering conventions
Assign account numbers by category, reserving ranges for related accounts and future additions. A common structure groups accounts into assets, liabilities, equity, revenue, and expenses, with the first digit typically identifying the main category.
Account Number Ranges
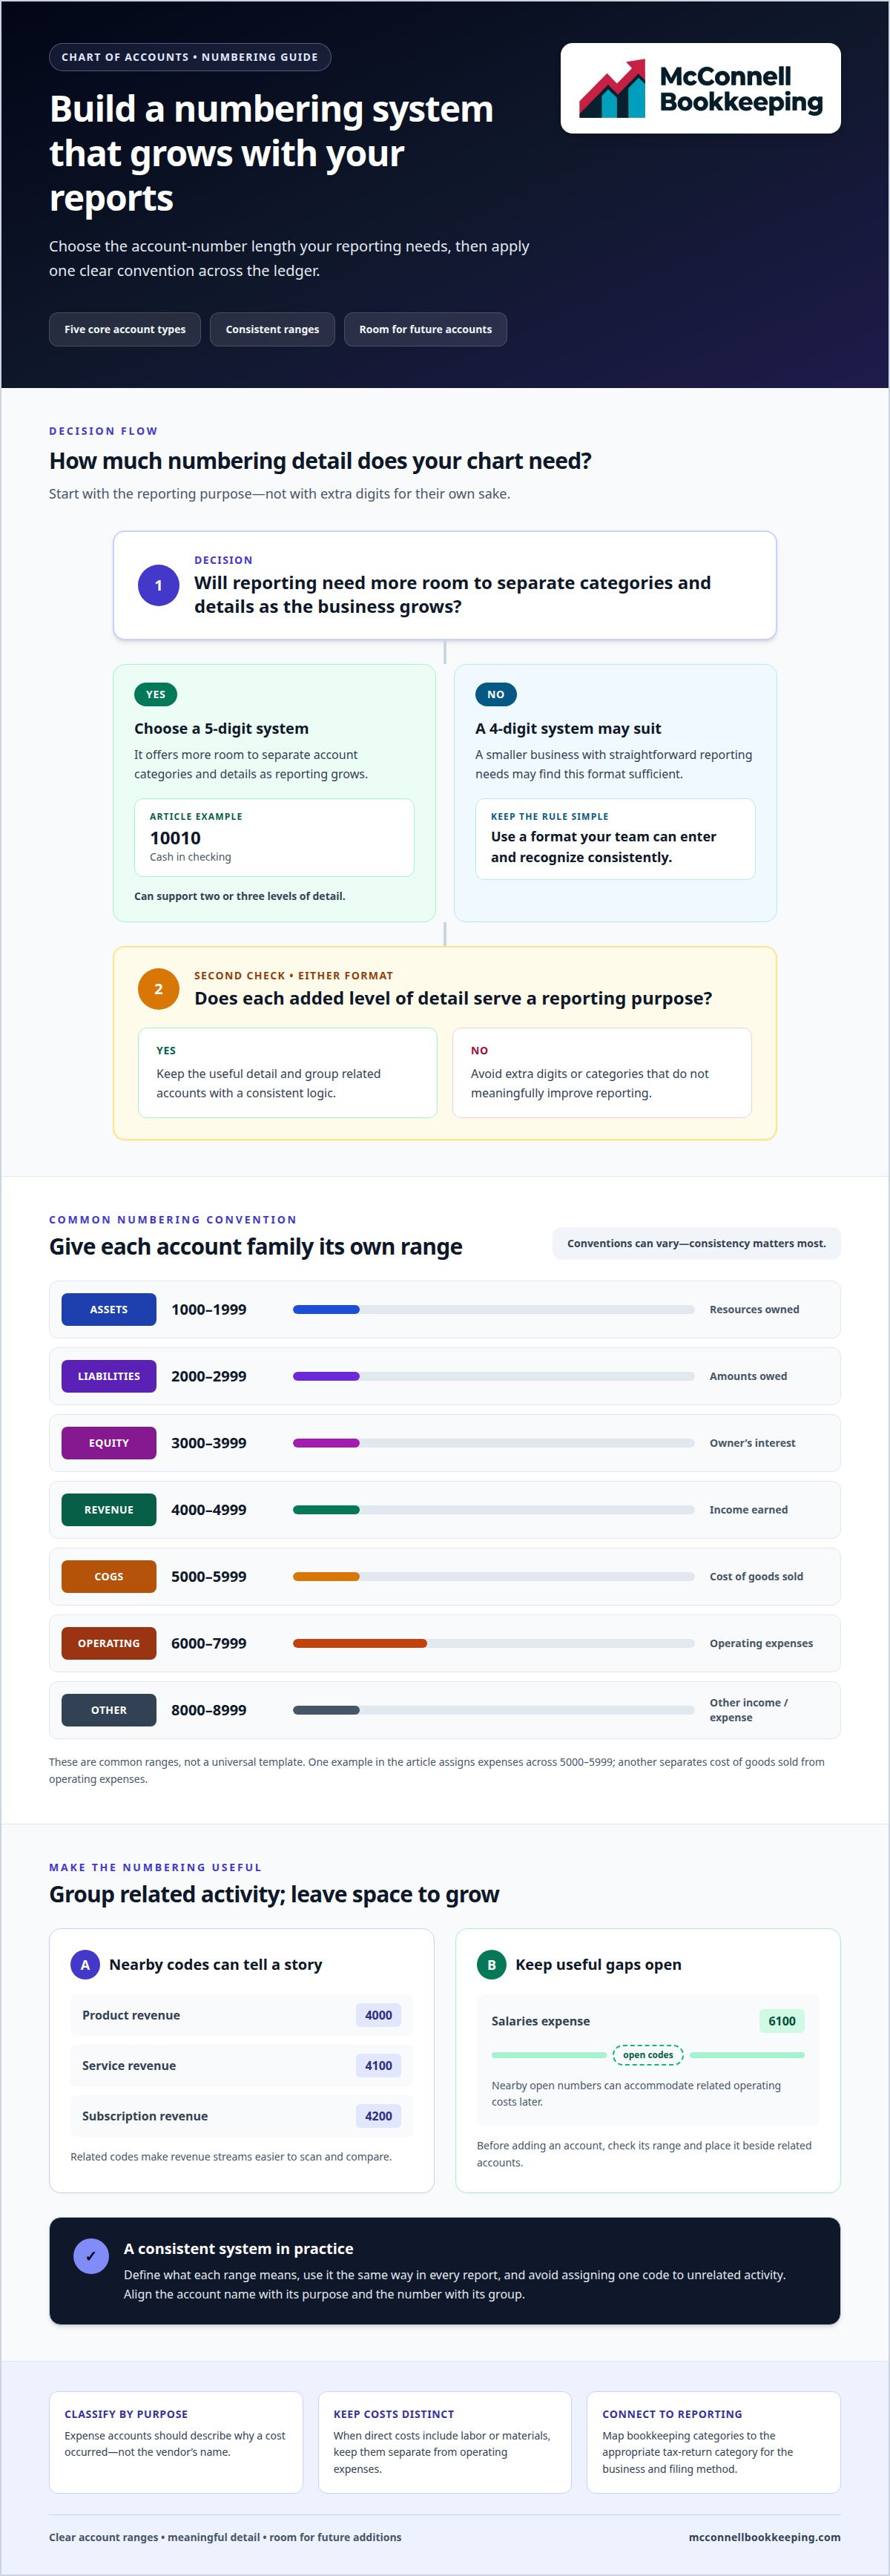
Account number ranges divide the ledger into recognizable groups, so each account has a clear place. A common hierarchy assigns assets 1000-1999, liabilities 2000-2999, and equity 3000-3999. Revenue commonly uses 4000-4999, cost of goods sold uses 5000-5999, and operating expenses use 6000-7999. Other income and expense may use 8000-8999.
These ranges are conventions, not a universal template. Apply your chosen structure consistently in your accounting software, and leave unused numbers within each range for accounts you may need later.
Grouping Accounts by Number
Numbering can group related accounts by assigning nearby codes to similar activity. For example, product revenue can use 4000, service revenue 4100, and subscription revenue 4200. That pattern makes it easier to scan financial reports and compare revenue streams without relying on account names alone.
Use the same logic within a category: keep similar expenses together and leave gaps between groups. A code such as 6100 can identify salaries expense within operating expenses, while nearby open codes can accommodate related operating costs later.
Choosing Account Number Length
Account number length determines how much detail the chart can hold. A 4-digit system may suit a smaller business with straightforward reporting needs. A 5-digit system offers more room to separate account categories and details as reporting grows.
For example, a five-digit code such as 10010 can represent cash in checking. Five digits can support two or three levels of detail, but extra digits only help when each level serves a reporting purpose. Choose a format your team can enter and recognize consistently.
Assigning Account Numbers
Understanding how to structure my chart of accounts starts with mapping the five account types to distinct ranges, then creating codes within each range. For example, 1010 can identify a cash operating account, 1150 accounts receivable, and 2010 accounts payable. Clear codes help staff classify transactions consistently.
Keep account names and numbers aligned: the name should explain the account’s purpose, while its code identifies its group. Before adding an account, review the existing range and place it alongside related accounts. A practical approach to how to structure my chart of accounts keeps records orderly as the chart grows.
The exact ranges can vary between charts. One example assigns expenses across 5000-5999, while another separates cost of goods sold into 5000-5999 and operating expenses into 6000-7999. The useful rule is consistency: define what each range means, use it the same way in every report, and avoid assigning one code to unrelated activity.
Mapping expense accounts to tax return categories
The main account categories are assets, liabilities, equity, revenue, and expenses. Organize expense accounts so each transaction has a clear bookkeeping category and can be reviewed for tax reporting. These categories form the foundation; account names and descriptions provide the detail needed to analyze activity.
A hierarchy keeps the chart organized without creating a separate account for every purchase. Start with a parent category, such as operating expenses, then group related costs beneath it. For example, office supplies and software can have separate accounts under a broader expense heading. This structure makes totals easier to review while retaining useful detail.
Assets: resources the business owns, such as cash or equipment.
Liabilities: amounts the business owes, such as outstanding bills.
Equity: the owner’s financial interest in the business.
Revenue: income earned from sales or services.
Expenses: costs recorded to operate the business or deliver its work.
Classify expenses by their purpose, not the vendor’s name. A payment to an office supply store belongs in the appropriate supplies account, not an account named for the store. This keeps transactions comparable and makes expense totals easier to review by function. If direct costs include labor or materials, keep them separate from operating expenses and classify them consistently.
Then connect each bookkeeping category to the appropriate tax-return category for the business and its filing method. A sole proprietor’s home-office expenses are reported on Schedule C Line 30. That example shows why a clearly labeled home-office account can make tax preparation easier to review, while keeping its transactions separate from general office costs.
Account labels should describe what was purchased or why the cost occurred. Avoid creating an account for every supplier or individual purchase; add a category only when it provides meaningful reporting detail. A consistent structure also makes it easier to compare spending across periods and catch misclassified transactions before finalizing reports.
Invoice coding is one place where consistent expense categories matter. Accounts Payable Management can help keep vendor bills organized under the appropriate accounts, supporting clearer expense records and more useful reporting.
Balance sheet and income statement account groupings
Separate accounts according to the financial statements they support, then group related activity for useful review. A logical structure helps owners connect transactions with assets, income, and operating results.
Statement Account Groupings
A balance sheet groups assets, liabilities, and equity; an income statement groups revenue and expenses. Set up distinct balance sheet groups for resources, obligations, and the owner’s interest. For example, classify cash and equipment as assets, unpaid bills as liabilities, and owner contributions as equity. This separation helps each statement present a coherent view.
Tailor the chart to the business’s activities and reporting needs. A service firm may need distinct service-revenue and subcontractor-cost categories, while a seller of physical products may need separate sales and direct-material accounts. Make the reporting purpose clear in account names so transactions land in the right group.
Functional Expense Groups
Functional expense groups classify costs by what they support, rather than by the vendor paid. For example, payments to different suppliers for office materials can go into one supplies account. This makes the overall cost easier to analyze than maintaining a separate account for each vendor.
Organize income accounts around meaningful revenue streams and expenses around business functions. A company with distinct product and service lines can use a separate revenue account for each. Keep direct costs apart from operating expenses when that distinction supports gross-margin reporting, and apply the classification consistently.
Header Accounts and Naming Rules
A header account groups related accounts for reporting but does not receive transactions itself. For example, a “Professional Fees” header can group legal, accounting, and consulting expense accounts. Clear labels explain the details beneath each group and help prevent an empty heading from being mistaken for an account used to record transactions.
Use a consistent naming pattern, such as “Expense: Office Supplies” and “Expense: Software.” Avoid mixing vendor names, abbreviations, and broad labels for similar costs. In a chart shared across locations, consistent names support consolidated reports; where the software allows, use classes or cost centers to track local activity.
How many accounts should a small business include? A chart with 40 to 80 accounts is sufficient for most small to mid-sized businesses. Let reporting needs guide the count: add detail when it helps compare meaningful activity, but consolidate small or infrequent items that do not need separate visibility.
Industry and business type determine which accounts need more detail. A manufacturer can distinguish direct materials from operating costs, while a service business can separate revenue streams. Start with the transactions the business actually records, then organize accounts around the reports owners use to make decisions.
For a company with multiple locations or business lines, keep the core account structure logical and consistent. Separate revenue accounts can show distinct business lines, while shared expense accounts prevent unnecessary duplication. When available, use local tracking dimensions for location-level analysis and keep the central chart readable and comparable.
Leaving room for future account growth
Leave open codes for new activity rather than forcing every addition into an awkward place. Reserved ranges let a business add accounts without renumbering established categories, helping reports stay consistent as operations change.
Plan space within each major account group before entering detailed accounts. For example, a manufacturer could reserve 5100-5199 for material-related costs. Raw materials might use 5100, with later codes available for packaging materials or other material categories. This structure keeps related costs together while giving the chart room to reflect new purchasing needs.
Reserve ranges for plausible business changes, not every possibility. A service business might leave unused codes beside service-revenue accounts for a new service line. A business adding locations could reserve a consistent block for location-specific accounts if separate accounts serve its reporting needs. The goal is to make additions logical, not to accumulate empty accounts.
Open codes also help prevent the chart from filling with duplicate labels. Before adding an account, compare its purpose with existing accounts and decide whether a new line will provide useful reporting detail. For instance, a business could add a distinct account for a new type of receivable if separate tracking improves collection oversight. If the activity fits an existing account, keep it there.
Accounting software may offer subaccounts or other tracking features, so consider how it represents account groups before reserving codes. If the software tracks locations through classes, for example, duplicate expense accounts for each location may be unnecessary. Align the chart with the way you prepare reports, and add accounts only when they clarify financial activity.
Growth can affect liabilities as well as revenue and expenses. New borrowing may call for clearer separation of balances, while a new sales channel may need its own revenue account. Reserve space in each relevant range, and define account names and purposes consistently. This makes additions easier to identify and helps preserve comparisons between reporting periods.
Review unused ranges when planning changes instead of treating every empty number as a reason to add detail. If you create an account for a temporary project, document its purpose and decide how its transactions will appear in reports. Keep reserved codes available until a real reporting need arises; every account should serve a clear purpose.
Keep a short numbering guide alongside the chart, showing which intervals are reserved and what each group represents. For example, note that 5100-5199 covers material-related costs and identify any codes already assigned. When a new account is needed, staff can use the next suitable code without disrupting established reports or creating inconsistent labels.
Adding new accounts and reallocating balances
Add an account when it gives transactions a clearer home or improves a report. First compare its purpose with existing accounts, then choose an appropriate number and name. For example, a business that wants to track marketing separately can add a marketing expense account rather than burying those costs in a broad category. Document the reason so future entries are classified consistently.
To customize a chart in QuickBooks or other accounting software, review the account list, identify a reporting need, and then add or edit accounts using the available chart controls. Keep the account type, name, and number aligned with the reports you need. Menus and account settings vary across software, so follow the controls in your system.
When reallocating a balance, define the source account, destination accounts, amount, and effective period before recording the change. Use an adjustment that preserves the total balance while assigning activity to its intended categories. For example, a $300,000 service-contract balance could be divided into $200,000 for Line A and $100,000 for Line B. The two new amounts add back to the original balance.
Document the reason and calculation for each reallocation. If an account combines different activities, use supporting transaction details to determine which amounts belong in each new account. Don’t estimate a split based on account names alone. For example, separate contracts by business line using invoices or other transaction records, then document the allocation method so reporting stays consistent.
Make chart changes at period-end to make comparisons between reporting periods easier. Before implementing a change, identify every report template, dashboard, and budget that references the affected accounts. Update them so Line A and Line B appear correctly in future reports. Check that prior-period reports still provide a consistent comparison after the change.
Take particular care with balance sheet accounts. If a change affects an asset, liability, or equity account, trace the balance to supporting records and keep the accounting entry balanced. For example, moving a balance between equity accounts changes its presentation, but the entry must still reflect the underlying transaction and preserve the integrity of the records.
For hands-on support organizing QuickBooks Online accounts and transactions, explore QuickBooks Online Training.
McConnell Bookkeeping: Monthly Bank Reconciliations
McConnell Bookkeeping provides Monthly Bank Reconciliations to match recorded activity with bank statements and identify differences that need attention. This can be a practical step after revising account categories or when you want dependable records behind your reports.
If past entries need reorganizing, Books Cleanup can help bring the books into a clearer structure. Financial Statement Preparation turns organized records into reports you can use to review business activity. Together, these services support consistent account balances and clearer reporting as your chart evolves.
If account changes make transactions difficult to classify or reports hard to interpret, McConnell Bookkeeping can help with Monthly Bookkeeping, Book Clean-up, Payroll Services, or Financial Analysis, depending on your needs. Contact McConnell Bookkeeping to discuss the bookkeeping support that fits your business.
Build a Clearer View of What Comes Next
A chart of accounts should evolve with the decisions you need to make. As your business changes, review whether account names still describe activity clearly and whether your reports answer the questions you rely on. Knowing how to structure my chart of accounts is a starting point; keeping it useful means connecting each change to accurate, well-organized records.
When updates expose older entries that need attention, McConnell Bookkeeping can support the work through Books Cleanup and Monthly Bank Reconciliations. Financial Statement Preparation can then turn organized records into reports that help you assess business activity. These services fit when your account structure is changing and you want your books and reporting to stay aligned.
Choose the next step that addresses the clearest bookkeeping need, whether that’s reconciling bank activity, cleaning up records, or preparing statements. Contact McConnell Bookkeeping to discuss support for your books and move forward with greater clarity.
Frequently Asked Questions
What is a typical chart of accounts structure for a small business?
A typical chart separates assets, liabilities, equity, revenue, and expenses, then adds accounts that reflect the business’s actual activity. A service business might distinguish consulting revenue from subcontractor costs, while a retailer may need separate sales and inventory-related accounts. Start with the categories your reports use, then add detail only when it helps explain cash flow, profitability, or obligations.
What are best practices for naming and grouping chart of accounts entries?
Choose account names that clearly state their purpose, and use one naming pattern throughout the chart. For example, “Software Expense” is easier to interpret than an abbreviation or vendor name. Group accounts by the activity they represent, and use consistent descriptions across teams or locations. A short naming guide helps staff classify similar transactions the same way.
How do I avoid duplicate or overly detailed accounts?
Before creating an account, compare its purpose with existing entries and decide whether separate reporting would change a business decision. An account with fewer than 5-10 transactions per year probably doesn’t need its own line. A chart with more than 150 accounts almost certainly has too much granularity, while fewer than 20 may lack useful detail. Consolidate overlapping categories when they serve the same reporting purpose.
How should a chart of accounts map to financial statements and tax forms in the United States?
Assign each account to the financial statement it supports, then use clear descriptions to make tax-category review easier. Assets, liabilities, and equity feed balance sheet reporting; revenue and expenses support income statement reporting. For example, sole proprietors report home-office expenses on Schedule C Line 30. Keep transaction descriptions and account categories consistent so records can be reviewed against the relevant return categories.
When and how should I revise or clean up a chart of accounts?
Review the chart annually, and consider changes when duplicate accounts, unclear balances, or new business activities make reports harder to use. For businesses in Mesa, Phoenix, Gilbert, Tempe, Chandler, and Scottsdale, period-end is a practical time to implement updates. Document the reason, map old accounts to new ones, and update any budgets, dashboards, or report templates that depend on them.



Comments